One of the lesser-known functions of Google Sheets is GOOGLE FINANCE. It allows you to track current or historical financial securities data on the stock market. Here’s how to Track Stocks with Google Sheets.

What is Google Finance?
Google Finance is Google’s own real-time tool that displays current market information and aggregates business news. It is currently integrated with Google Search.
In case you look up the ticker symbol of a specific corporation on Google such as WMT for Walmart or AAPL for Apple then, you will immediately see the current stock quote and historical data for that security.
You can simply click one of these stocks to go to a company’s Google Finance page, which will show the company’s financials, related news, and allows you to compare it with other commodities.
While there are other options, more robust tools you can use to track securities, Google Finance is the only one that can effectively integrate with Google Sheets. Whether you are a novice to stocks or an experienced trader, this integration is the easiest way to import and monitor stock data in the spreadsheet.
Furthermore, Google Finance’s sheets integration is only available in English and does not include most international exchanges yet. So if you want to transact on Asian or European exchanges then this may not be the best option for you.
The Google Finance Function
The function that pulls stock data in google is called “GOOGLE FINANCE.” The syntax of the function is quite easy and uses five arguments, four of which are optional.
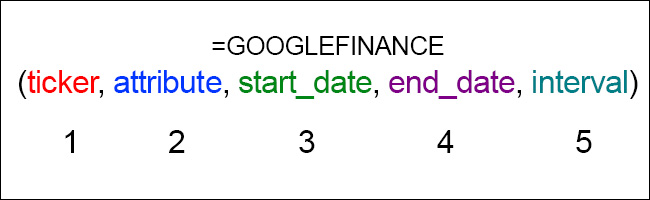
The first argument is the ticker symbol. These are codes that companies have when they are listed on the stock market, like GOOG for Google or BAC for Bank of America.
You can also specify the stock exchange that your chosen stock is listed in order to avoid discrepancies. Since Bank of America is listed on the New York Stock Exchange, just type “NYSE:BAC.”
To get the ticker codes and exchanges of your desired stocks, you will have to do some research. You can look for them on Google Finance by yourself or your chosen portfolio management tool.
The second argument is the attribute that you would like to display. By default, it is set to “price” if you leave it blank. Below are a few of the attributes you can pull out using the function:
1. price: The price of the specific stock in the real-time.
2. volume: The current trading volume.
3. high: The current or chosen day’s high price.
4. low: The current or chosen day’s low price.
5. volumeavg: The average trading daily trading volume.
6. pe: The price to earnings ratio.
7. eps: The earnings per share.
Kindly take note that the attributes you can display vary on whether you are using current or historical data. Here’s a full list of attributes that you can use for the argument. It is important to remember that current data refreshes every 15 minutes, so it is not just completely real-time.
The third argument is the start date, which only applies if you are using historical data. You can type “TODAY()” or leave it blank in order to display real-time data.
The fourth argument specifies either the end date or the number of days from the start date. If left blank, the function will return the data from a single day.
The last argument is the interval, which allows you to specify the frequency of the data. You can set it to “DAILY” or “WEEKLY.”
One thing to note is that Google Sheets processes the ticker symbol and attribute arguments as text, so make sure to place quotation marks around them, or you will get an error.
Stock Tracking in Action
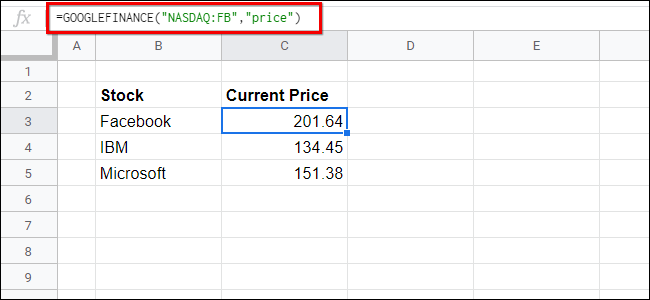
For this example, let us say you wish to look up the current price of a stock of Facebook. Facebook lists on NASDAQ with the ticker code of FB.
In this case, you will type down the first argument as “NASDAQ:FB” along with “price” as the attribute. So the formula for this will be =GOOGLEFINANCE(“NASDAQ:FB”,”price”).
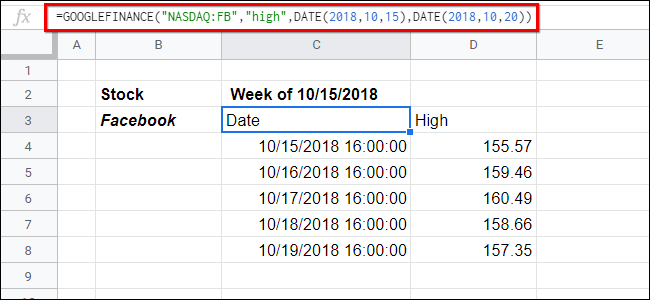
In case you want to view the daily closing prices for a particular week, such as the week of October 15, 2018, then you will specify that date range in the third and fourth arguments.
The code for that becomes =GOOGLEFINANCE(“NASDAQ:FB”,”price”,DATE(2018,10,15),DATE(2018,10,20)). Kindly note that viewing historical data expands the generated information into array data, which takes up nearby cells.
You can also use the function to generate data for a list of stocks automatically. Simply type out the tickers in a column, then use the cells in your first argument.
Since our ticker code is in cell C4, you will type out =GOOGLEFINANCE(C4,”price”). Below is a list of stocks with their corresponding current prices.
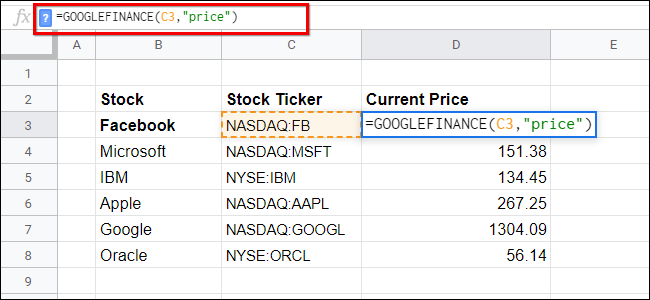
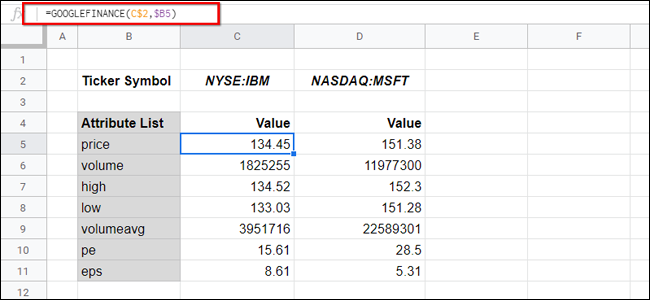
In case you want to track a list of attributes, then you can type them out in separate cells like in the above image. After that, you can link the second argument to the cell with the attribute’s name. For the price cell for NYSE:IBM in the example below, the formula will be =GOOGLEFINANCE(C$2,$B5).
Maximizing Google Sheets
The best part about having your stocks on Google Sheets is that you can use various data manipulation tools on them.
For example, let us say you want to use Google Sheets to keep track of the value of all of your financial assets, like your stocks, savings accounts, time deposits, and more. Using Finance, the price of your stocks will update in real-time, so you will get a full picture of your position at any given time.
Converting Currency with Sheets
Another great function of Google Sheets is that it can convert currencies in real-time very easily. You can do this by typing the stock ticker “CURRENCY:” then followed by the codes of the two currencies you want to convert, such as “USDGBP” or “EURJPY.” You can also display historical currency data.
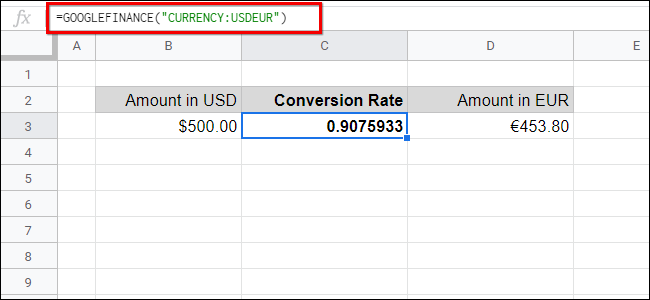
For example, in case you are living in Europe and you want to convert some USD into the Euro, you would type =GOOGLEFINANCE(“CURRENCY:USDEUR”) and multiply that number with the amount of USD that you are converting.
This also has a lot of great use-cases besides foreign exchange trading. For example, if your line of work your employer pays you in a different currency, then you can set up an invoice that automatically converts the payments you receive to your home currency.
لدي محفظه في جوجل فينانس و اشتريت فيها أسهم و لها قيمه عاليه و كل مره القيمه تزيد و لكن هل هذا المال قابل للسحب